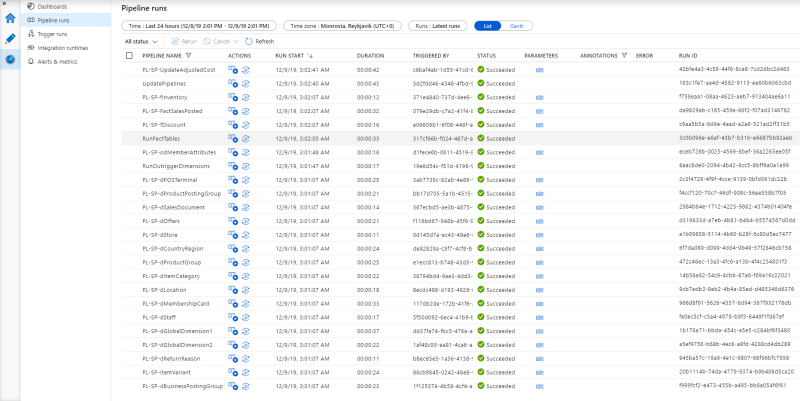
To monitor the individual pipeline runs and review if anything failed, you can go into the monitor section of the data factory:
- Open Author & Monitor for the data factory, and select the blue meter icon below the pencil in the left navigation menu.
- Select Pipeline runs, and the time and status of the last pipeline run is displayed.
If you want to monitor a triggered run, you can do so by selecting Trigger runs in the left navigation menu and review whether the triggered run of the pipelines ran successfully or failed.
If it failed, you can then open Pipeline runs to review which pipelines failed during the triggered run.
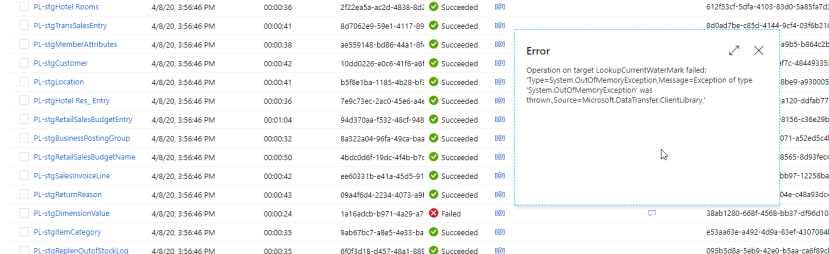
When a pipeline fails to run, the status in the list is set to Failedand an icon is added to the Error column. If you hover over the icon, the error is displayed and describes what prevented the pipeline from running. The Troubleshooting topic lists some of the most common errors and their resolution.